Gantt Chart
By: A Staff Writer
Updated on: Jul 19, 2024
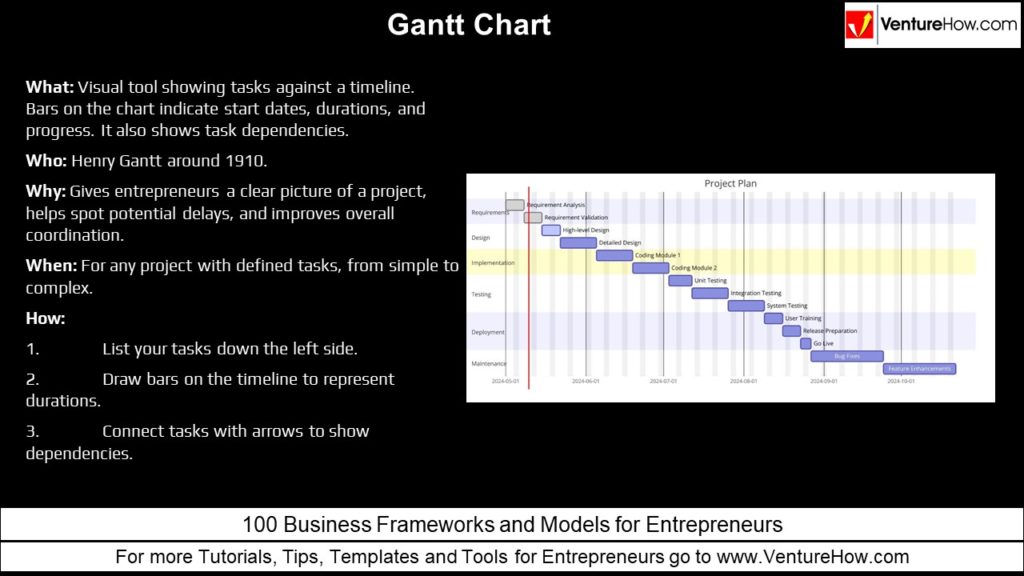
What: Visual tool showing tasks against a timeline. Bars on the chart indicate start dates, durations, and progress. It also shows task dependencies.
Who: Henry Gantt around 1910.
Why: Gives entrepreneurs a clear picture of a project, helps spot potential delays, and improves overall coordination.
When: For any project with defined tasks, from simple to complex.
How:
-
- List your tasks down the left side.
- Draw bars on the timeline to represent durations.
- Connect tasks with arrows to show dependencies.