Fishbone Diagram (Ishikawa Diagram)
By: A Staff Writer
Updated on: Jul 19, 2024
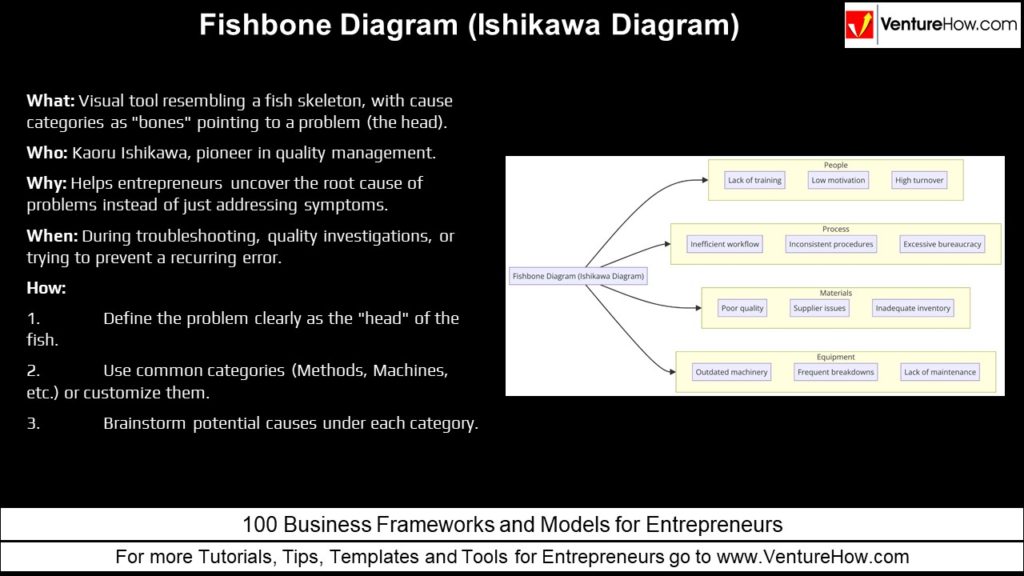
What: Visual tool resembling a fish skeleton, with cause categories as “bones” pointing to a problem (the head).
Who: Kaoru Ishikawa, pioneer in quality management.
Why: Helps entrepreneurs uncover the root cause of problems instead of just addressing symptoms.
When: During troubleshooting, quality investigations, or trying to prevent a recurring error.
How:
-
- Define the problem clearly as the “head” of the fish.
- Use common categories (Methods, Machines, etc.) or customize them.
- Brainstorm potential causes under each category.